
Forecasting XU100 Stock Close Price Using Istanbul Weather History
I needed to find out whether forecast reports had affected Istanbul stock market’s closing prices. I just wanted to try what can be done with time series analysis methods and WEKA and display it then prepare a report accordingly.
I downloaded last 1 year Istanbul weather data from http://www.wunderground.com/ and I got Istanbul last year’s BIST index close values from my lovely friend Ibrahim Kahraman . He is a master of these financial stuff.
Introduction
A time series can be defined as a sequence of measurements taken at (usually equally spaced) ordered point in time. Recently, Machine Learning (ML) techniques have been applied to time series data for prediction of next points in time (forecasting), and the results show great improvement over classical techniques (e.g. ARIMA). Ahmed et al. applied several ML algorithms to the problem of time series forecasting and they suggest Multilayer Perceptron and Gaussian Process regression as the best methods [1]
Often, preprocessing the time series data is needed to remove samples with missing values, add new attributes based on lag mechanism and merge time series from different sources. To allow propositional learning algorithms (e.g. Artificial Neural Networks) to capture the relationship between current and past values of the exploratory variables and the outcome, new variables should be created. The lag variables create a “window” over a time period and they may take a finite number of lagged values into account (Finite Distributed Lag model, or FDL) or they may use an infinite distributed lag (e.g. all past values) [2] .
Methods
To investigate the relation between the Istanbul weather and XU100 stock close price, these two datasets were merged together by date. The Istanbul weather history contains 22 variables daily spaced in time from May 13, 2014 to May 13, 2015. The XU100 index dataset contains the close stock price for the same period of Istanbul weather history. However, the stock market does not open on weekends and holidays, so these two data series must be join together to have the same periodicity.
In order to create the dataset composed by both time series data the Data Mining software Weka (Hall et al. 2009) was used. The Figure 1 shows the workflow used to generate the merged dataset implemented using Weka Knowledge Flow tool. Firstly, both time series dataset are load into memory and then they are sorted by date attribute, being joined to compose a new dataset. At this point useless attributes are removed, such as the duplicated date attribute (present in both time series) and the attributes with large number of missing values from Istanbul weather dataset (Events). This process also applies the LN function to the stock price and standardize all data to have zero mean and unit variance [3] . It is needed to remove any tendencies in time series data, such that they oscillate around the mean. Finally, it generates the ARFF file (Weka format file) and plots for each attribute in the generated dataset.
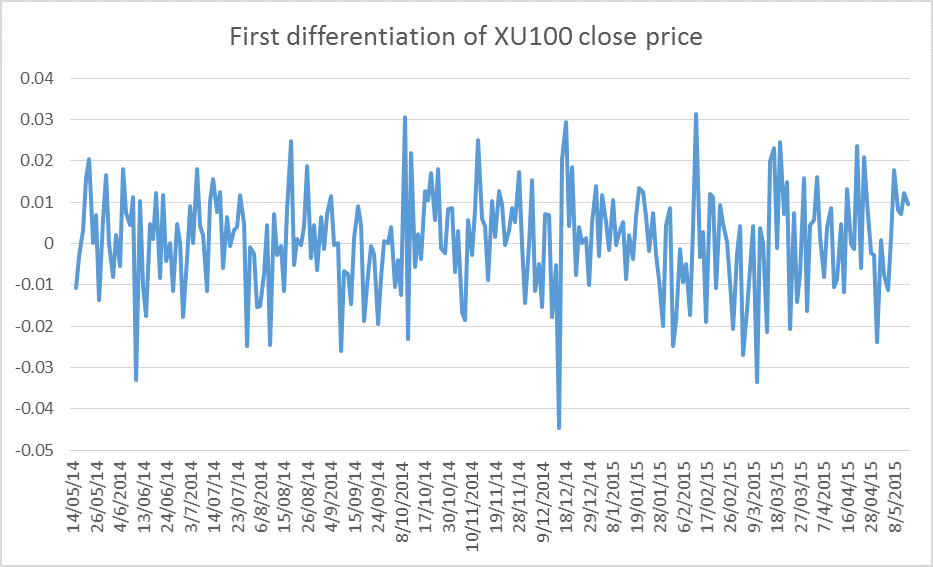
A common approach is to differentiate the time series to avoid data tendencies and to obtain a time series that oscillate around the mean. It can be achieved by subtracting the previous value (t -1) from the current value, and it can be repeated (e.g. second differentiation) until the data shows an oscillation around the mean[3].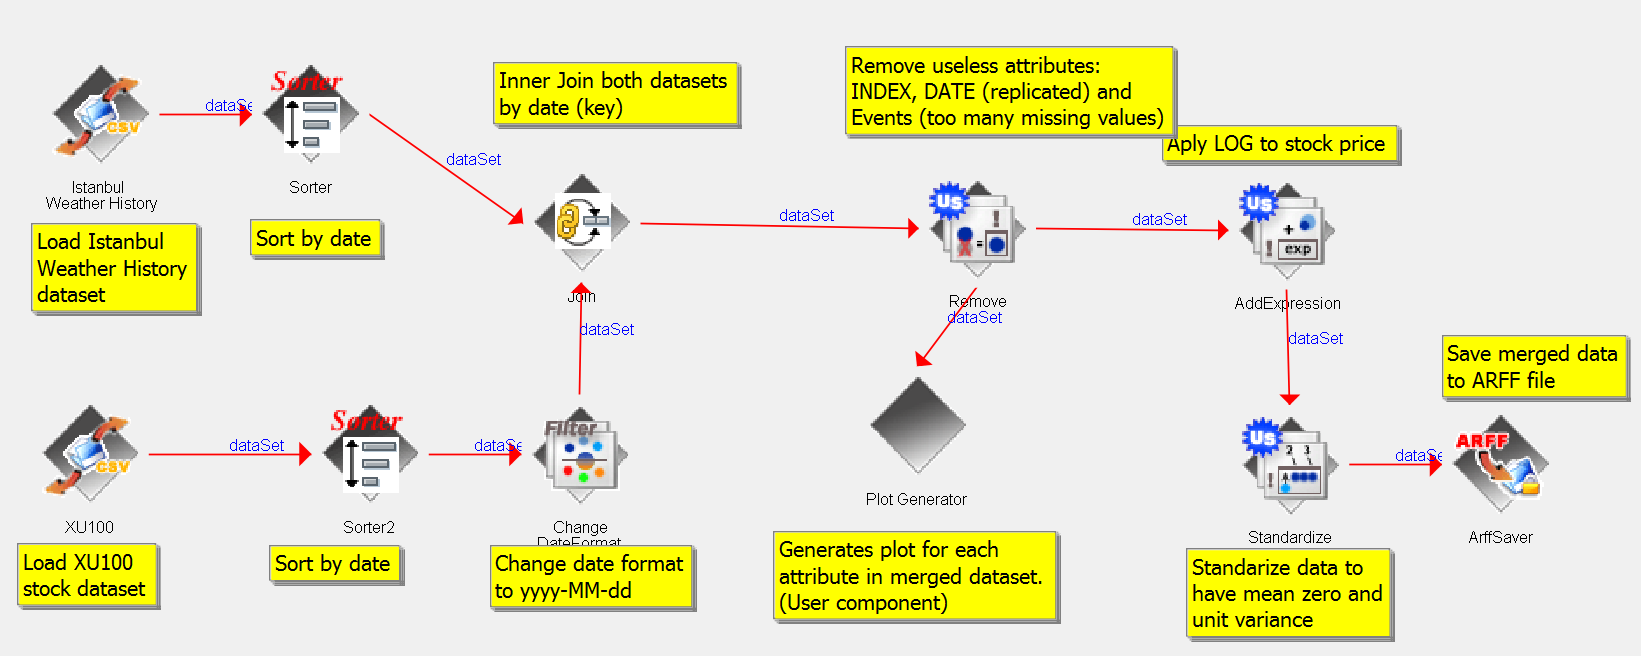
Weka (version >= 3.7.3) has a plugin for time series analysis and forecasting, which can be installed using Package Manager. Basically, it creates new variables called lag variables,which correspond to a shift in the future of time series. So for a lag length of one the new variable created represents a time shift of one point in the future having the value of the previous point (past). The plugin allows the preprocessing of the dataset by the creation of lag variables making possible to build any regression model [5] .
Although, there are many techniques to find the optimal length of lag, Weka does not provide any direct method, and only has an internal method that estimates the lag length using the periodicity of the time series. However, the lag length can be set to high values follow by the application of Principal Component Analysis to reduce the data dimensionality. In this work the lag lengths varying from 1 to 5 (working days in a week) and then the PCA is applied when needed to reduce the dimensionality of data.
Using the new data set generate by merging the Istanbul weather and XU100 stock price, the Weka Time Series Analysis and Forecasting plugin was applied to process and build regression models. The regression models allow the analysis of how the Istanbul weather interferes (correlates) with stock price and, can further be used to predict (forecast) the stock price in future.
A multilayer perceptron, support vector machine for regression ( SMOReg ), Random Forest and Gaussian Process were used to evaluate the correlation between the Istanbul weather and XU100 stock price. All evaluations were made using a separated test set composed of 30% of the time series data and the Mean Absolute Error (MAE) and Root mean squared error (RMSE) are calculated for each model. All models are built using the default parameters.
Polynomial Kernel were used with SMOReg and Gaussian Process with default parameters ( K(x,y) = <x, y> ), and the Multilayer perceptron with one hidden layer composed of 23 neurons. The Random Forest model was built using 100 random trees, unlamented tree sizes and a maximum 5 attributes in each tree.
Posteriorly, the models were compared and the best model suitable for forecasting the XU100 stock price based on Istanbul weather was elected based on lowest RMSE. The algorithm used to train the best model was then used to train e evaluate a model trained without weather information.
Forecasting analysis usually uses previous points in a time series to predict futures points, and it could be applied to the XU100 stock prices directly without incorporating weather information. Build a model using only stock price data is interesting to compare with models which uses weather information and then, to evaluate if weather information can improve the stock price prediction. If the predictions are improved it is a clear evidence that weather has a relation with the price of XU100.
Results and Discussion
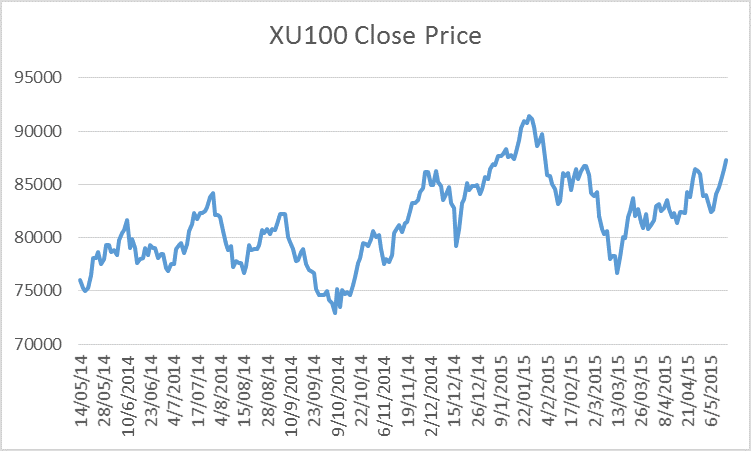
The XU100 stock price shows a non-stationary behavior, as showed in Figure 2 where a tendency is observed. For that reason, the differentiation and standardization preprocessing should be applied to alleviate the tendency in time series and reduce their impact on regression models training phase.
The time series of Istanbul weather shows great correlation between its attributes, as can be seen from the plots in Appendix A. Usually, the values of maximum, minimum and mean of each type of attribute show the same tendency and it suggest their correlation and dependency, what definitively makes sense in weather measurements.
Have the data be processed and prepared by Weak plugin, the regression models were created using the Filtered Classifier of Weka software to allow the preprocessing of data using Principal Component Analysis. PCA gives lower errors (MAE and RSME) and better generalization capacity.
The error measurements taken from training the regression models are not a good estimate of the real power of the models in forecasting stock prices. For that reason, the error calculated using the test set is used to compare the models and to elect the best model, as well as, to investigate the correlation between stock price and Istanbul weather. The errors on training and test sets for each model were showed in Table 1.
From Table 1 we can elect the Gaussian Process as the best model for forecasting XU100 stock price, however, the error of the best model can still be considered high for practical proposes. While, all models have shown good performances on training set (due to over fitting), the performances on test sets are considerable lower in sense that one can argue that the weather has a low influence in the XU100 stock price. However, when we compare with the model without incorporation of weather information, the results are lower than previous models (with weather information).
| Model | Train | Test | ||
| MAE | RMSE | MAE | RMSE | |
| SMOReg | 0.3437 | 0.5139 | 0.6748 | 0.8806 |
| Multilayer Perceptron | 0.1067 | 0.1511 | 0.7765 | 0.9925 |
| Random Forest | 0.1993 | 0.2568 | 0.6847 | 0.8503 |
| Gaussian Process | 0.3911 | 0.4888 | 0.644 | 0.833 |
| Gaussian Process w/o weather info | 0.4442 | 0.5936 | 0.7885 | 0.9558 |
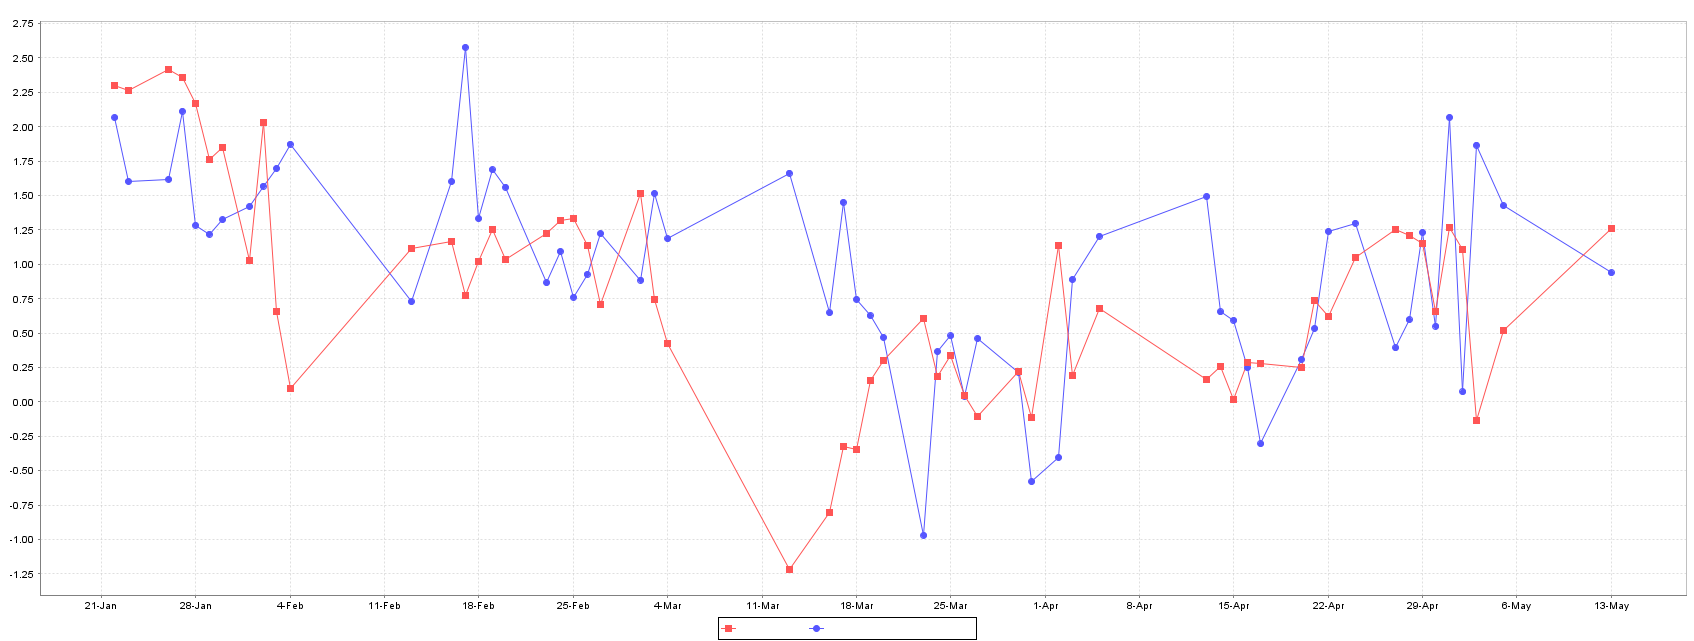
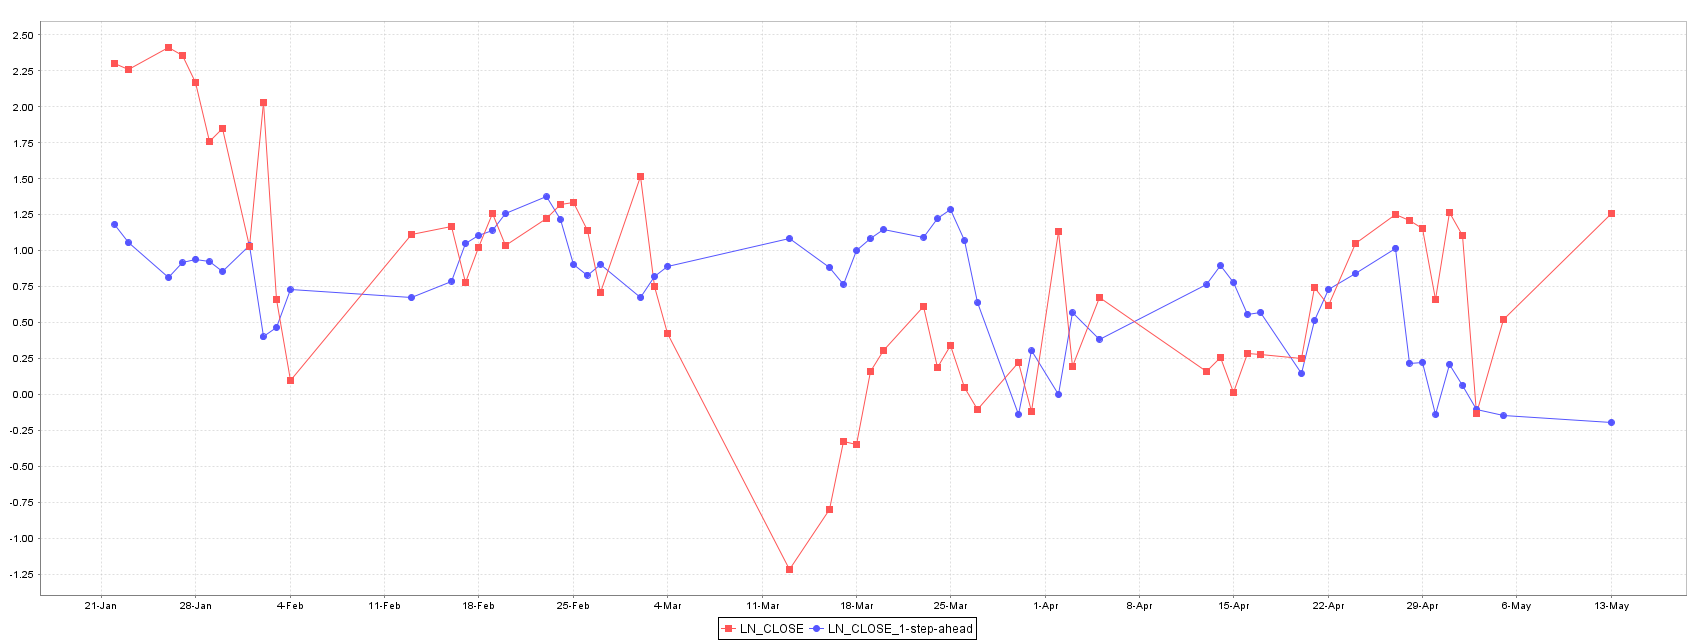
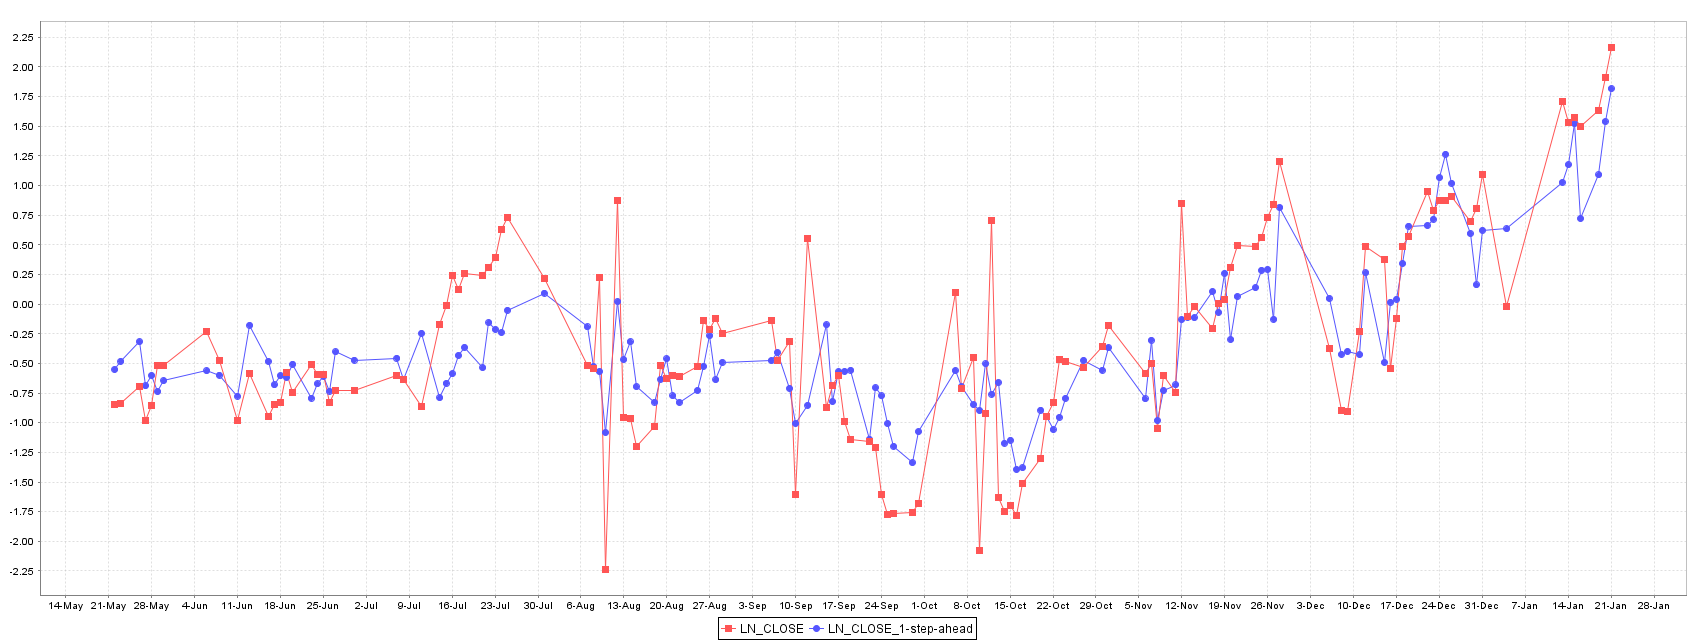
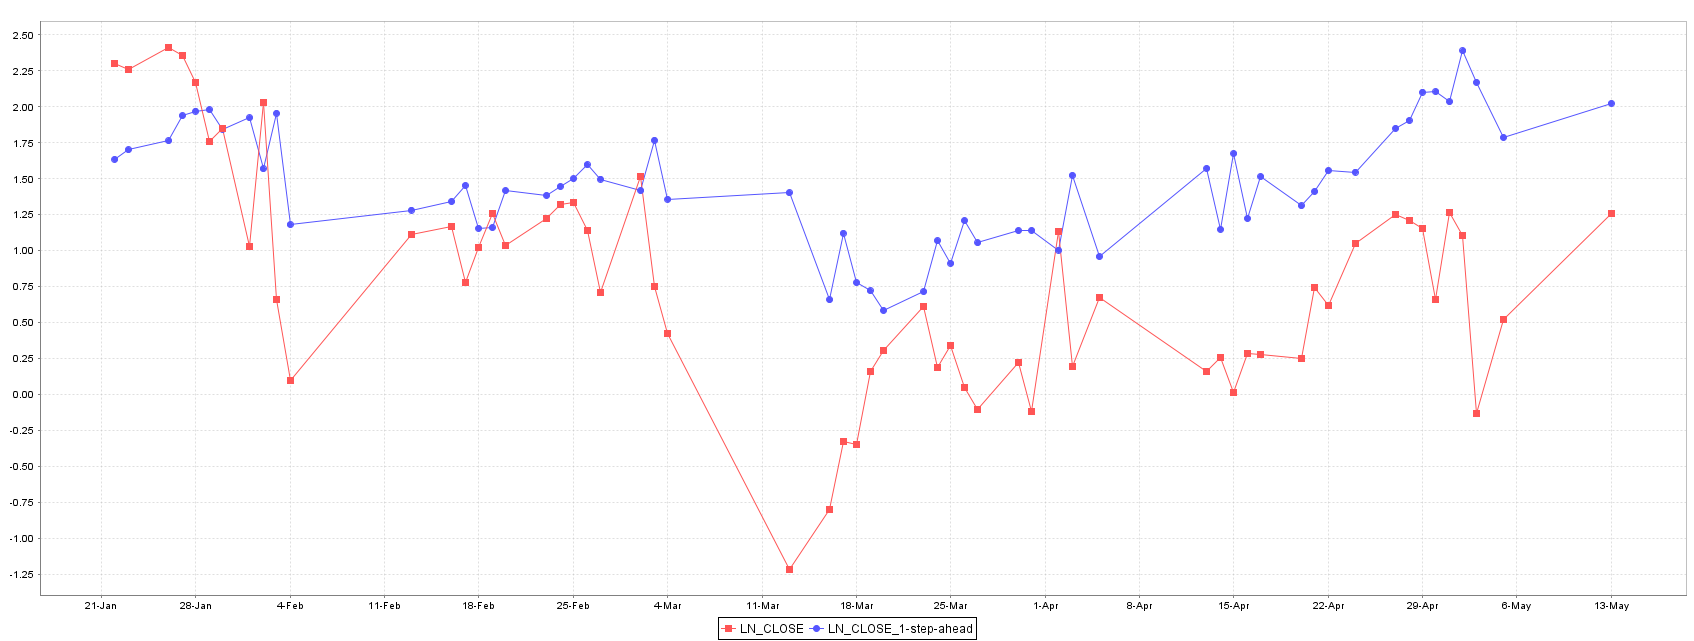
The SMOReg shows a relative higher error in train, when compared to other methods. However, on test set it performs better than Multilayer Perceptron and equivalent to Random Forest, as can be seen in plots of Figure 3.
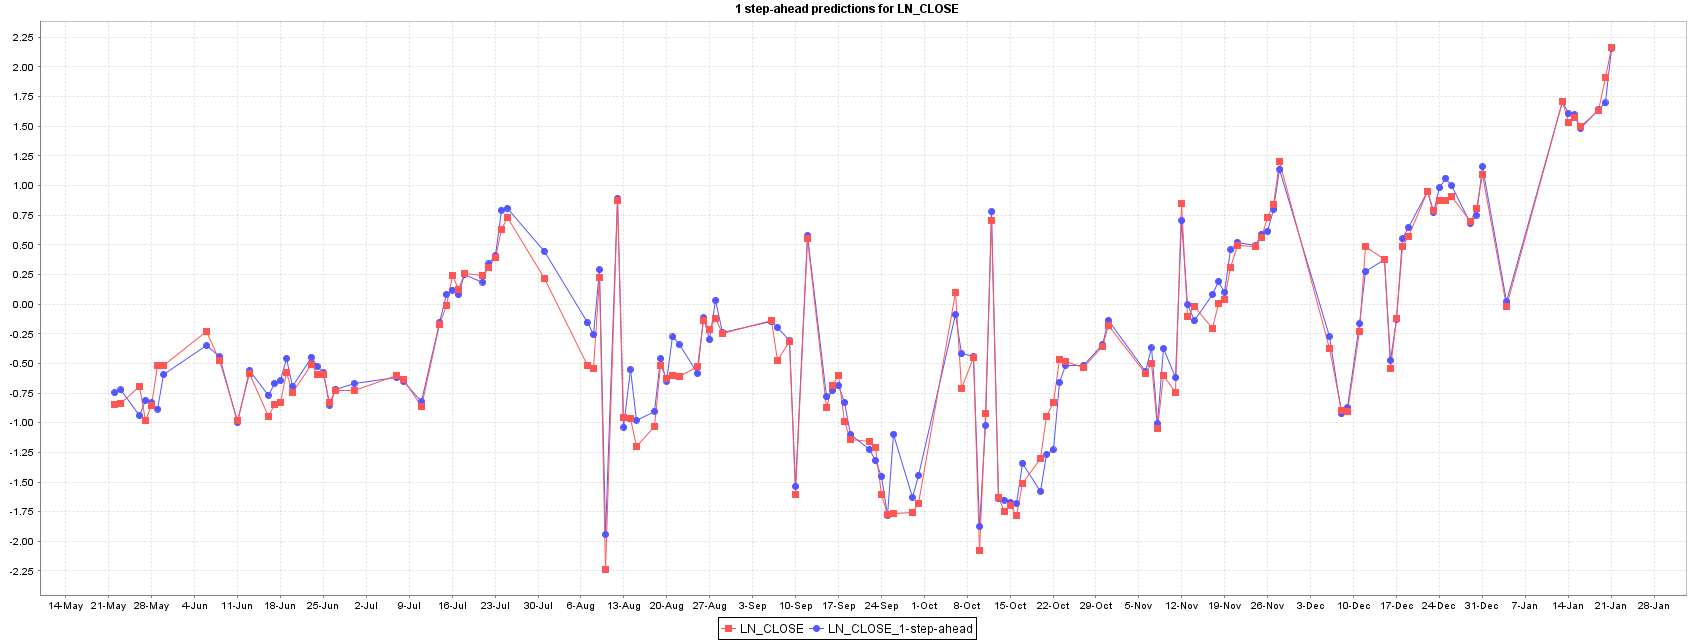
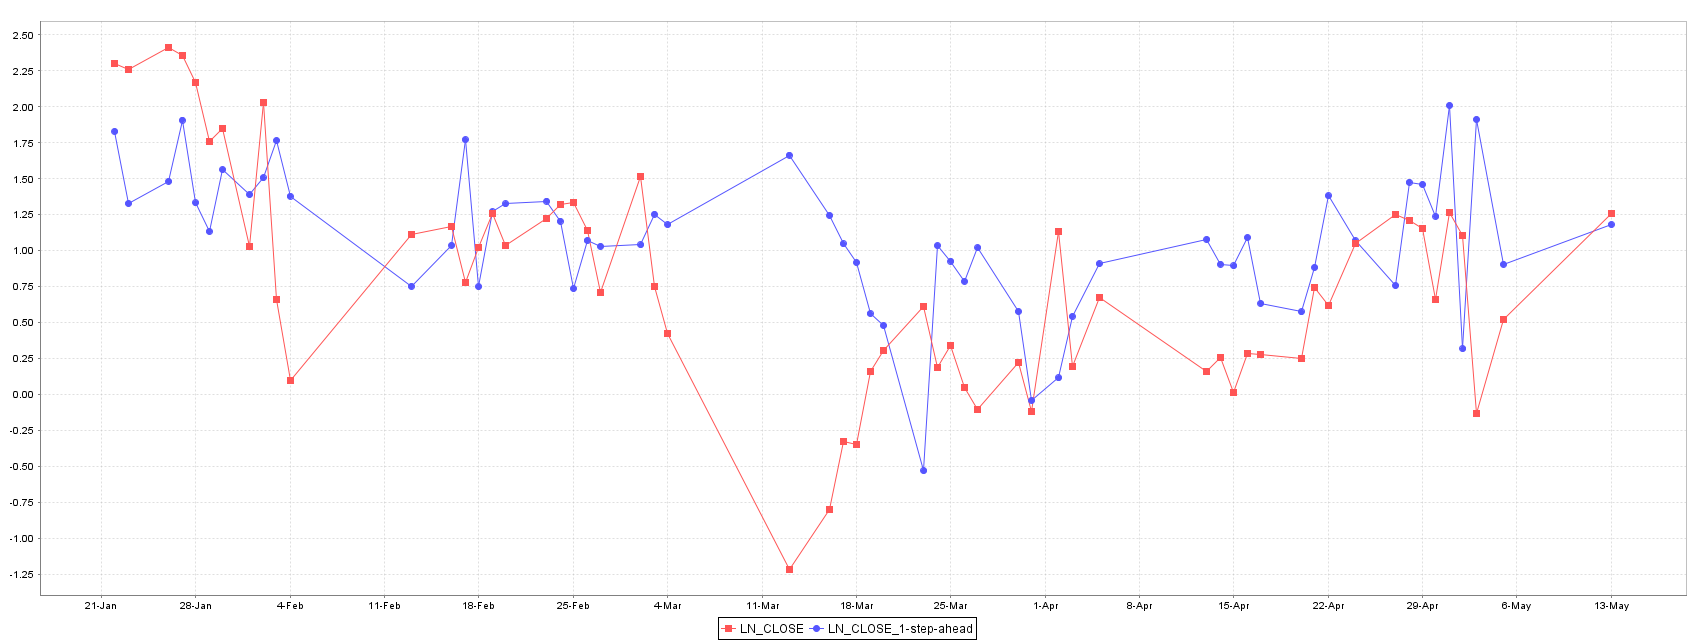
Multilayer perceptron model shows the best RSME in training set giving a high fitted predictor, but its generalization error it highest between all models, suggesting an over fitting of the model during training phase (a common problem in Artificial Neural Networks), as Figure 4 shows.
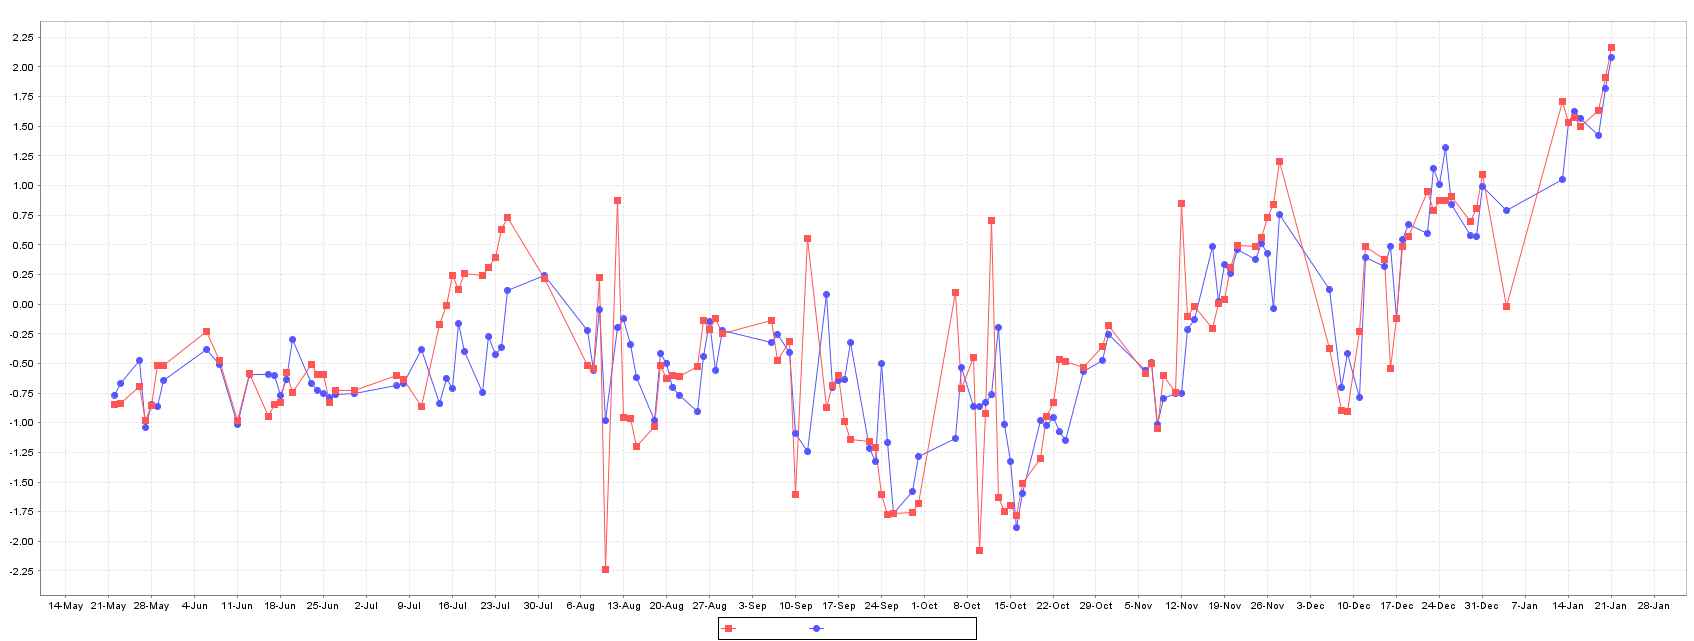
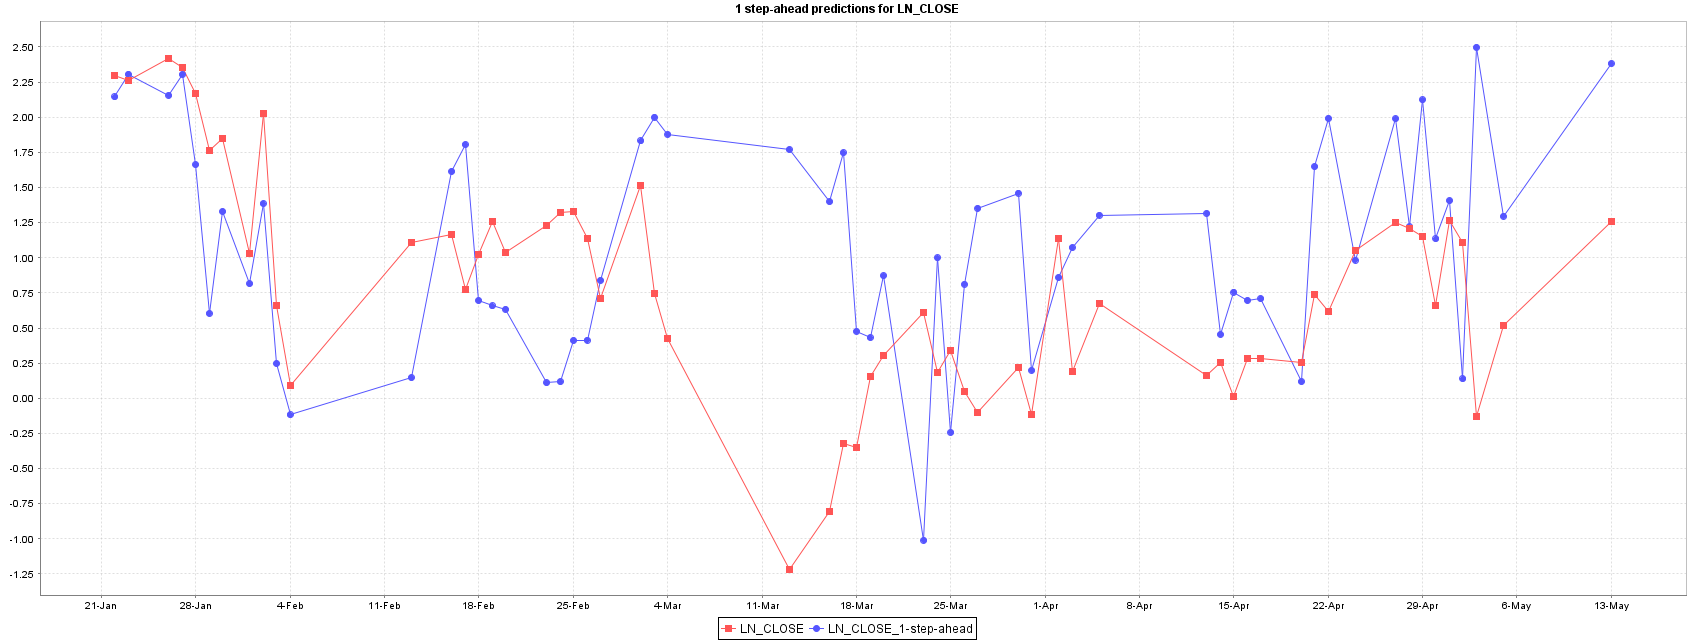
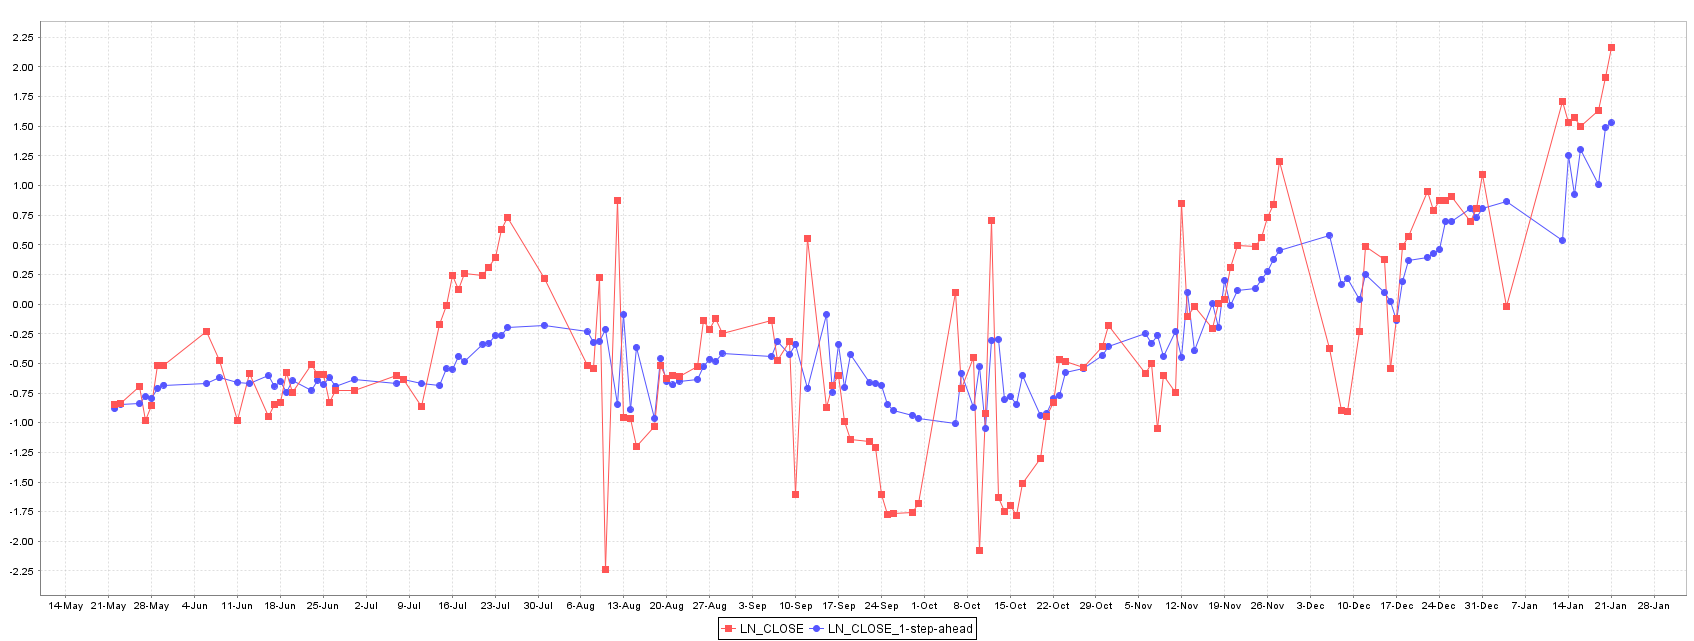
The best model for forecasting XU100 stock price is the Gaussian Process, followed by Random Forest and SMOReg. Random Forest shows an intermediate performance between Gaussian Process and SMOReg, and their predictions and error are quite equally distributed as showed in Figures 5 and 6.
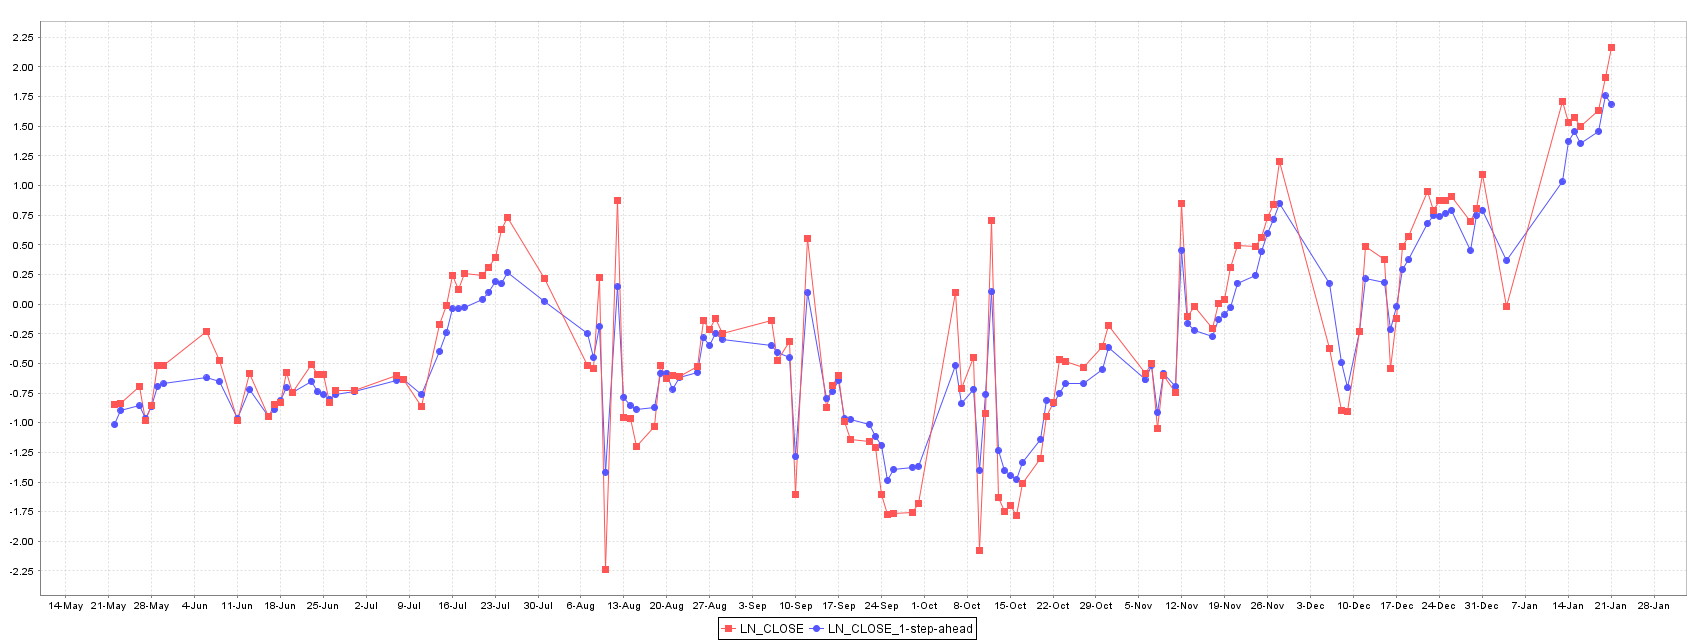
The Gaussian Process model without weather information shows the worst error in training and test set suggesting a relation between the Istanbul weather and XU100 stock price (Figure 7).
Conclusion
By the analysis of different regression models for forecasting of XU100 stock price, we can see that since models perform well in training sets, they are not well suitable for predict the stock price in an independent test set, where an increase in MAE and RMSE are observed. While a correlation between Istanbul weather and stock price means that models can provide low error predictions of future prices, definitely, by the comparison between the models trained with and without weather information, stays evident that weather information can improve predictions. Not only the improvements achieved by the introduction of weather variables, but also due similar trends between both time series can suggests a correlation between Istanbul weather and BIST National Index 100 (XU100).
Despite of the improvement caused by addition of weather information on forecasting the stock price of XU100, finding how the weather can impact into stock price is a difficult task, and often a more detail analysis has to be made in order to elucidate these facts, for example the investigation of what kind of companies are indexed in Bist National 100 and what are they line of work.
References
- Ahmed, N.K. et al., 2010. An Empirical Comparison of Machine Learning Models for Time Series Forecasting. Econometric Reviews.
- Cromwell, J.B., 1994. Multivariate Tests for Time Series Models, Issue 100, Sage Publications. Available at: https://books.google.com/books?id=_1Ohg5mPXLQC&pgis=1 [Accessed May 19, 2015].
- Chatfield, C., 2013. The Analysis of Time Series: An Introduction, Sixth Edition, Available at: https://books.google.com/books?hl=pt-BR&lr=&id=qKzyAbdaDFAC&pgis=1 [Accessed May 19, 2015].
- Hall, M. et al., 2009. The WEKA data mining software. ACM SIGKDD Explorations Newsletter, 11(1), p.10. Available at: http://dl.acm.org/citation.cfm?id=1656274.1656278 [Accessed November 25, 2014].
- Kedem, B. & Fokianos, K., 2005. Regression Models for Time Series Analysis, John Wiley & Sons. Available at: https://books.google.com/books?id=8r0qE35wt44C&pgis=1 [Accessed May 19, 2015].
Share this on → Tweet